
Research
B2B SaaS Marketing Spend
Private B2B SaaS firms spend a median 8% of ARR on marketing and 15% on selling, says SaaS Capital's 2026 survey. Why another survey says 35%, with the working.
Key figures
- Median marketing spend, private B2B SaaS, % of ARR (SaaS Capital survey of 1,000+ companies, completed March 2026)
- 8%
- Median selling spend, private B2B SaaS, % of ARR (same survey, up from 13% a year earlier)
- 15%
- How much more equity-backed companies spend on marketing than bootstrapped ones, at the median (SaaS Capital's own comparison)
- +100%
- Median sales and marketing expense, % of revenue, calendar 2025 (Benchmarkit 2026 report, N = 196)
- 35%
How much of its revenue a private B2B SaaS company puts into marketing and into selling, read off the two 2026 surveys that print their numbers as text, with every place where pages quoting them go wrong. Every figure was read at source on 11 November 2026.
The 2026 survey medians: 8% on marketing, 15% on selling {#saas-capital}
The median private B2B SaaS company spends 8% of its annual recurring revenue on marketing, unchanged on the year before, according to SaaS Capital’s 2026 Spending Benchmarks, published 10 June 2026 and read on 11 November 2026. The same survey puts the median spend on selling at 15% of ARR, up from 13%. It is SaaS Capital’s 15th annual survey, completed in March 2026, with more than 1,000 SaaS companies responding.
The other department medians in the same post are research and development 22%, general and administrative 15% (up from 14%), customer support and success 9% (up from 8%), hosting 5%, professional services cost of goods 5%, DevOps 4% and other cost of goods 3% (up from 2%), all as a median percent of ARR, as of March 2026.
Whose numbers these are matters. SaaS Capital is a lender that provides credit facilities to SaaS companies, and these are its survey respondents’ own answers about themselves, not audited accounts. The question asked for a “percentage of revenue”; the results are reported as a percent of ARR. That is the first denominator trap on this subject, and it is printed here as SaaS Capital prints it.
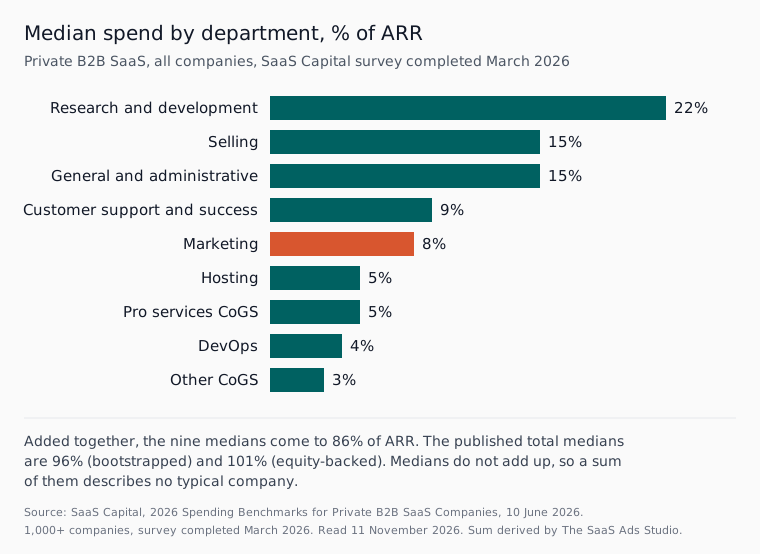
The nine department medians add up to 86% of ARR. That is a derived figure: 22 plus 15 plus 15 plus 9 plus 8 plus 5 plus 5 plus 4 plus 3, every input from SaaS Capital’s 2026 post, added up by us on 11 November 2026. The same post gives the total median spend as 96% of ARR for bootstrapped companies and 101% for equity-backed ones. The sum falls short of both because the median of each line comes from a different company. No typical company spends 86%.
Bootstrapped against equity-backed {#funding}
Funding changes the marketing line more than any other cut in SaaS Capital’s 2026 survey. By SaaS Capital’s own comparison of the medians, equity-backed companies spend 100% more on marketing than bootstrapped companies, 70% more on sales, 56% more on R&D, 64% more on general and administrative costs and 100% more on customer success. The underlying medians for each group are published only in a chart, so they are not repeated here as numbers.
The same survey (read 11 November 2026) reports median growth of 20% a year for bootstrapped companies and 25% for venture-backed ones, and says 83% of bootstrapped companies are within two percentage points of breakeven or profitable against 52% of equity-backed companies. SaaS Capital notes that funding and growth are correlated and that the relationship may not be causal, so double the marketing spend is not evidence of what that spend buys.
By size: the $3M to $5M ARR band {#by-arr}
For a company with $3 million to $5 million of ARR, SaaS Capital’s 2026 post gives median spend, as a percent of ARR, of 8% on marketing, 12% on selling, 24% on R&D, 15% on general and administrative, 10% on customer support and success, 5% on hosting, 3% on DevOps, 5% on professional services cost of goods and 3.5% on other cost of goods. The bands are drawn in US dollars of ARR. The other bands are in a gated summary report that was not opened for this page, so only this band is carried.
A percentage carries no currency, so it can be applied to a budget in pounds without converting anything. As a worked example only: at £1,000,000 of ARR, 8% is £80,000 a year (1,000,000 multiplied by 0.08), or £6,667 a month (80,000 divided by 12, rounded to the pound). That is derived from SaaS Capital’s 8% median as of March 2026, and it is the whole marketing line: people, tools, events and media together.
The other 2026 dataset says 35% {#benchmarkit}
The median B2B SaaS company spent 35% of revenue on sales and marketing combined in calendar 2025, down from 37% in calendar 2024, according to Benchmarkit’s 2026 B2B SaaS and AI-Native Metrics report, pages 73 and 76 (N = 196, read 11 November 2026). The report covers 342 participating B2B SaaS and AI-native software companies, with Aleph as presenting sponsor on the report page. Like SaaS Capital’s, it is a self-reported survey.
Page 76 of the report calls the change a decline of “2 percent”. It is 2 percentage points. As a relative fall it is 5.4%: derived, 37 minus 35, divided by 37, as of the calendar 2025 figures read 11 November 2026. The same page says the highest-spending companies, which it calls the fourth quartile, fell from 55% to 47% of revenue. On cost metrics a “top quartile” can mean the lowest numbers, so read “fourth quartile” here as the page describes it: the most aggressive investors in sales and marketing.
Two more lines from the same report, page 74: companies growing 31% to 50% a year had the highest median at 44% of revenue, and companies growing faster than 50% spent 35%, the same as the whole population. Benchmarkit’s page 73 also says the 35% median “closely aligns” with much larger public companies. It gives no source for that comparison, so it is Benchmarkit’s claim and is not carried as a figure.
Why 23% and 35% are both right {#denominators}
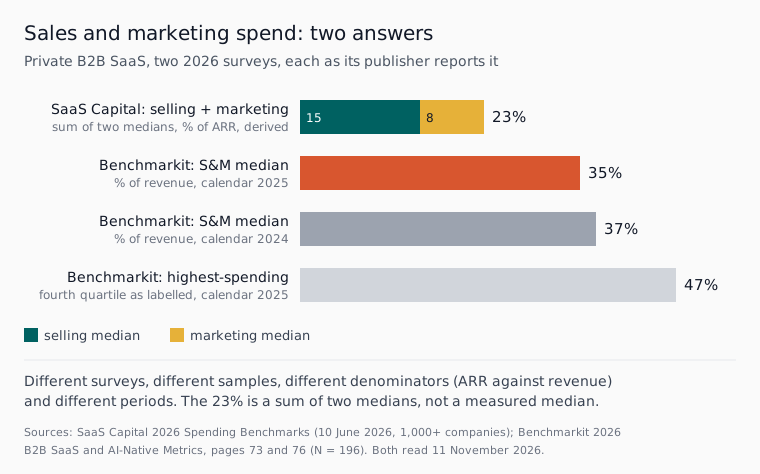
Put the two surveys side by side and the obvious move is to add SaaS Capital’s selling and marketing medians, which gives 23%. That is derived: 15% plus 8%, both from SaaS Capital’s 2026 post as of March 2026. It is not a measured sales and marketing median, for the reason the 86% above shows, and it should never be quoted as one. Against Benchmarkit’s 35% it differs in four ways at once:
- Denominator. SaaS Capital reports a percent of ARR; Benchmarkit reports a percent of revenue.
- Period. SaaS Capital asked what is spent “currently” in a survey completed in March 2026; Benchmarkit uses calendar 2025 actuals.
- Sample. 1,000+ respondents to SaaS Capital against 196 who answered this question for Benchmarkit.
- Arithmetic. Benchmarkit measured one line; the 23% adds two medians from different companies in SaaS Capital’s survey.
So the honest reading is not that one survey is wrong. A company comparing itself should pick one survey, use its denominator, and compare one line with one line.
What neither survey says {#gaps}
Neither survey splits marketing spend by channel, so neither says what share goes on paid search or paid social. A paid-ads share of the SaaS marketing budget credited to either of them has no source in it.
The other dataset this market cites is High Alpha’s. High Alpha’s benchmarks page describes its report as previously operated by OpenView and, when read on 11 November 2026, still carried the 2025 edition (800+ respondents) with a “Take the 2026 Survey” link live. Its charts are published as images, so none of its figures is carried here. A spending figure credited to an “OpenView 2026” or “High Alpha 2026” report had no published source on that date.
What this means if you are running ads
An 8% marketing line at £1m of ARR is £80,000 a year for everything, as worked above, so the media budget inside it is a smaller number that has to earn its place against people and tools. Our Google Ads budget bands and B2B SaaS CAC benchmarks pages cover what that media buys, and the rest of this series is listed at SaaS Ads Studio research. If you want that Google budget run every week inside limits you set, Atlas manages Google Ads for SaaS and every Google change can be undone for 30 days; you can start at app.saasadsstudio.com.
Method
Every figure was read on 11 November 2026: the SaaS Capital post as live text, and the Benchmarkit report as text extracted from the PDF linked as “Full Report” on its report page. Figures held only in charts or gated reports were not carried.
Four figures on this page are derived, each from the linked SaaS Capital and Benchmarkit figures: the 86% sum of nine department medians; the 23% sum of the selling and marketing medians; the 5.4% relative fall (2 divided by 37); and the £80,000 a year and £6,667 a month worked example (£1,000,000 multiplied by 0.08, then divided by 12). The sums are shown to make a point about medians and are not benchmarks.
Both surveys are self-reported by the companies in them. SaaS Capital is a lender to SaaS companies; Benchmarkit is a benchmarking firm whose 2026 report has a software vendor, Aleph, as presenting sponsor. No Atlas account data is used on this page, and no figure on it describes any customer of ours.
Questions people ask about this
- What percentage of revenue should a B2B SaaS spend on marketing in 2026?
- There is no should, only what peers do. In SaaS Capital's 2026 survey the median private B2B SaaS company spent 8% of ARR on marketing and 15% on selling, and the median at $3M to $5M of ARR was also 8% on marketing. Equity-backed companies spent about twice what bootstrapped ones did on marketing.
- Does the 8% include salaries?
- The survey does not say. It asked what percentage of revenue is currently spent on marketing and did not define what belongs in the line, so each company answered with its own chart of accounts. Treat 8% as the whole marketing function, not as an ad budget.
- Is sales and marketing spend 23% or 35% of revenue?
- The 35% is Benchmarkit's median for sales and marketing as one line, measured against revenue, for calendar 2025. The 23% is not a published figure at all: it is SaaS Capital's selling median plus its marketing median, and a sum of two medians is not the median of the sum. Different samples, denominators and periods do the rest.
- How much of the marketing budget goes on paid ads?
- Neither survey on this page splits the marketing line by channel, so neither says what share goes on paid search or paid social. A paid-ads share of the SaaS marketing budget credited to either of them has no source behind it.
Sources
- 1. SaaS Capital, 2026 Spending Benchmarks for Private B2B SaaS Companies (Nick Perry, 10 June 2026; 15th annual survey, 1,000+ companies, completed March 2026) Read 2026-11-11.
- 2. Benchmarkit, 2026 B2B SaaS and AI-Native Metrics, report page (Aleph presenting sponsor) Read 2026-11-11.
- 3. Benchmarkit, 2026 SaaS and AI Metrics Benchmarks, full report PDF (342 participants, calendar 2025 actuals; pages 73 and 76 cited here) Read 2026-11-11.
- 4. High Alpha, 2025 SaaS Benchmarks Report (ninth annual, previously operated by OpenView), still the current edition when read Read 2026-11-11.
Cite this page
Free to quote and free to cite, with a link back. No permission needed.
The SaaS Ads Studio, "B2B SaaS Marketing Spend", 2026. https://saasadsstudio.com/research/b2b-saas-marketing-spend/
Reading this with a machine? Plain markdown version .
