
Research
B2B SaaS CAC Benchmarks
B2B SaaS CAC benchmarks read off the 2026 primary report: a 16-month median payback, $1.30 and $1.63 CAC ratios, and the top-quartile figure pages misquote.
Key figures
- Median CAC payback, B2B SaaS, calendar 2025, months (198 companies reporting)
- 16
- Median CAC payback at annual contract values under $5K, calendar 2025, months
- 11
- Median blended CAC ratio, US dollars of sales and marketing spend per $1 of new and expansion ARR
- $1.30
- Median new name CAC ratio, US dollars of sales and marketing spend per $1 of new customer ARR
- $1.63
- Median CLTV to CAC ratio, calendar 2025 (146 companies reporting)
- 4.1x
What a normal customer acquisition cost looks like for a B2B SaaS, measured the way finance teams and investors measure it, from the one 2026 dataset that prints its sample sizes. Every figure was read off the primary report on 28 October 2026, and where pages quoting that report disagree, this page says which number the report actually prints.
Which dataset, and why only one {#dataset}
The freshest public set is the 2026 B2B SaaS and AI-Native Metrics benchmarks from Benchmarkit, with Aleph as presenting sponsor, published on 1 June 2026. According to the full report, read on 28 October 2026, it covers calendar 2025 actuals from 342 B2B SaaS and AI-native software companies. Each metric has its own sample: 198 companies reported CAC payback, 122 the blended CAC ratio, 128 the new name CAC ratio and 146 CLTV to CAC. It is a self-reported survey, so these are companies’ own figures about themselves, and the headline framing, that go-to-market efficiency “has inflected”, is Benchmarkit’s reading of them rather than a measurement.
The other dataset this market cites is High Alpha’s SaaS Benchmarks Report, which High Alpha’s own page describes as previously operated by OpenView. When read on 28 October 2026 that page still carried the 2025 edition, the ninth, from 800+ respondents, with a “Take the 2026 Survey” link live. Its CAC charts are published as images rather than text, so none of its figures is carried here. Any CAC figure credited to an “OpenView 2026” or “High Alpha 2026” report had no published source on that date.
CAC payback: 16 months at the median {#payback}
The median B2B SaaS company took 16 months in calendar 2025 to recover its sales and marketing spend from the gross margin on new customer ARR, down from 18 months in calendar 2024, according to Benchmarkit’s 2026 report, pages 10 and 11 (N = 198). The report calls that an 11% improvement and gives 14 months for calendar 2023, so the series has gone 14, 18, 16 rather than falling in a straight line.
The formula, as Aleph’s summary of the report states it (read 28 October 2026), is prior-period sales and marketing expense, divided by new ARR added multiplied by gross margin, multiplied by 12. Two things follow for anyone comparing their own number. The numerator is the whole sales and marketing line, salaries included, not an ad account. The denominator is margin rather than revenue, so a lower-margin business reads longer at the same spend.
6 months or 10 months for the top quartile?
Pages quoting this report give two different numbers for “the top quartile”, and both come from the same page of it. Page 10 of the report says the spread runs from the first quartile at 10 months to the fourth at 24 months, then says the top quartile pays back in 6 months or less and gives 48 months for the fourth quartile. Page 11 settles which is the percentile: the 25th percentile fell from 12 months in calendar 2024 to 10 months in calendar 2025. So 10 months is the line a company has to beat to sit in the top quarter, and 6 months is a figure from inside that quarter which the report does not define further.
Aleph’s summary prints both numbers, and describes 48 months as the worst case in the sample, which the report itself does not say. The safe quotation is 10 months for the top-quartile threshold and 24 months for the bottom-quartile threshold, both from the report, calendar 2025.
Payback by segment {#by-segment}
The all-company median hides a range of 10 to 22 months across the report’s own cuts, all from pages 12 to 14 of the report and the same 198 companies. By annual contract value, in US dollars as published, the median was 11 months under $5K against 22 months at $50K to $100K. By solution type it was 14 months for horizontal B2B SaaS against 18 for vertical. By 2025 growth rate it was 10 months for companies growing over 50%, 22 for 21% to 30%, 18 for 11% to 20% and 14 under 10%.
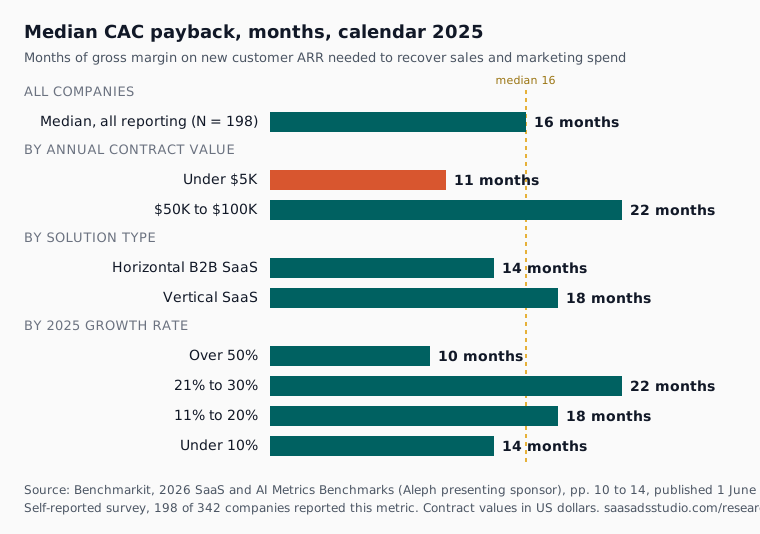
Two readings in the report are interpretations, not measurements, and are labelled as such here. It credits the under-$5K figure to “high-volume, low-touch digital acquisition”, and it suggests the 21% to 30% growth band, the slowest at 22 months, may be companies absorbing elevated CAC while they look for more growth (report, pages 12 and 13). Neither cause is tested in the data.
Three CAC ratios, three denominators {#ratios}
The CAC ratio is the same idea as payback expressed as dollars of sales and marketing spend per dollar of ARR, without the margin adjustment. The report publishes three of them, which is why pages quoting it disagree about “the” CAC ratio. All medians below are calendar 2025, in US dollars, from Benchmarkit’s 2026 report.
- Blended CAC ratio: $1.30 per $1 of new and expansion ARR (report page 15, N = 122), down 7% from $1.40 in calendar 2024 (page 19).
- New name CAC ratio: $1.63 per $1 of new customer ARR (report page 20, N = 128), down from $2.00 in calendar 2024, which the report calls an improvement of about 19% (page 21).
- Expansion CAC ratio: $0.80 per $1 of expansion ARR (report page 48, N = 74).
That the blended ratio counts expansion ARR is the report’s own description: page 21 says the blended improvement came “primarily” from new logos, “not just expansion optimization”. Because spend and ARR are in the same currency, a ratio carries over to pounds unchanged: $1.30 per $1 is £1.30 per £1 for a company billing in pounds.
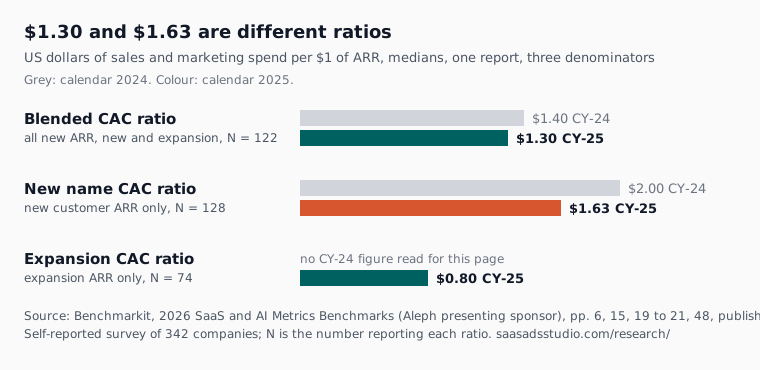
By contract value, the report gives a blended ratio of $0.80 under $5K against $1.71 at $50K to $100K (page 16), and a new name ratio of $2.81 in the $50K to $100K band, its highest (page 24).
The 53% that the medians put at 51%
Page 6 of the report says expanding a customer is “53% cheaper” than acquiring one. Its own medians give a different figure.
50.9% cheaper: derived, 1 minus ($0.80 divided by $1.63), both medians from Benchmarkit’s 2026 report, pages 6 and 48, calendar 2025. $0.80 divided by $1.63 is 0.4908, so a dollar of expansion ARR cost 49.1% of what a dollar of new customer ARR cost, which is 50.9% cheaper. The two medians come from different samples (N = 74 and N = 128) and the report does not show how it reached 53%, so this page quotes the medians and its own working rather than either percentage as settled.
CLTV to CAC: 4.1x {#ltv-to-cac}
The median CLTV to CAC ratio was 4.1x in calendar 2025, with the top quartile at 7.8x, according to page 26 of the report (N = 146). The report calls 1.1x “the 1st quartile floor”. On this page “1st quartile” means the weakest companies, where on the payback pages “first quartile” meant the strongest, so check the direction before quoting any quartile from this report. Vertical SaaS posted 5.6x against 4.1x for horizontal (page 6).
Aleph’s summary, read 28 October 2026, says the median held at 3.6x to 3.7x from 2022 through 2024 and computes lifetime value on gross margin divided by churn. The 3:1 line that most pages treat as the target is a convention: the report calls it “widely cited” and gives no source for it.
What this means if you are running ads {#running-ads}
A Google Ads cost per conversion is not CAC. It counts media only, and the conversion is usually a signup or a demo request rather than a paying customer, so getting from one to the other takes your own signup-to-paid rate and the sales and marketing cost that sits outside the ad account. The nearest public cut to a self-serve SaaS buying search ads is the under-$5K band in Benchmarkit’s 2026 report: 11 months payback and a $0.80 blended CAC ratio, calendar 2025. For what a monthly budget buys in clicks and leads, see Google Ads budget bands, and for the other benchmark sets and their traps, SaaS ad benchmark sources. Every page in the set is listed in the research index.
If you want the paid search part of that number worked on every week, Atlas builds and runs SaaS Google Ads inside safety rails you set, and you can start free with conversion tracking.
Method
Every figure on this page was read on 28 October 2026 off the Benchmarkit report PDF, with page numbers given, or off Aleph’s summary pages where the statement is Aleph’s. Nothing was carried over from an earlier page or from an aggregator, and no figure from High Alpha’s 2025 report is used, because its CAC data is published only as chart images.
One figure is derived: the 50.9% gap between expansion and new name CAC, worked in full in its section from two medians on pages 6 and 48 of the report. Everything else is printed by the source.
Whose claim is whose: the dataset is a self-reported survey run by Benchmarkit, a benchmarking firm that sells sponsorships of its research, with Aleph, a finance software company, as presenting sponsor. The causes the report gives for its numbers are its interpretations and are labelled as such. Aleph’s pages are a sponsor’s summary, and where they say something the report does not (the 48-month worst case), this page says so. The report labels quartiles in opposite directions on different pages, and every quartile quoted here gives its direction.
This page uses no Atlas account data. It will be re-dated when High Alpha publishes its 2026 edition.
Questions people ask about this
- What is a good CAC payback period for a B2B SaaS in 2026?
- The median in calendar 2025 was 16 months across 198 companies in Benchmarkit's 2026 report. The top quarter of companies paid back in 10 months or less and the bottom quarter took 24 months or more. Compare within your contract size: the median was 11 months under $5K a year and 22 months at $50K to $100K.
- Does the 16-month figure include sales salaries?
- Yes. The formula divides the whole sales and marketing expense line by gross margin on new ARR, so salaries, commissions and tools sit in the numerator alongside media. An ad account's cost per conversion is a much smaller number for that reason.
- Why do some pages say the median CAC ratio is $1.30 and others $1.63?
- Both are in the same report and both are right. $1.30 is the blended ratio, measured against new and expansion ARR together. $1.63 is the new name ratio, measured against new customer ARR only. Quote the one whose denominator matches yours.
- Is there a 2026 OpenView or High Alpha CAC benchmark?
- Not as of 28 October 2026. OpenView's report moved to High Alpha, whose current edition is the 2025 one, with the 2026 survey still open. A CAC figure credited to an OpenView 2026 or High Alpha 2026 report has no published source yet.
Sources
- 1. Benchmarkit, 2026 B2B SaaS and AI-Native Metrics, report page (Aleph presenting sponsor, published 1 June 2026, 342 companies, calendar 2025 actuals) Read 2026-10-28.
- 2. Benchmarkit, 2026 SaaS and AI Metrics Benchmarks, full report PDF (page numbers cited on this page) Read 2026-10-28.
- 3. Aleph (the report's presenting sponsor), CAC payback period benchmarks for SaaS (2026), last updated October 2026 Read 2026-10-28.
- 4. Aleph, LTV:CAC ratio: what's good for SaaS in 2026?, last updated October 2026 Read 2026-10-28.
- 5. High Alpha, 2025 SaaS Benchmarks Report (ninth annual, formerly OpenView's), current edition when read Read 2026-10-28.
Cite this page
Free to quote and free to cite, with a link back. No permission needed.
The SaaS Ads Studio, "B2B SaaS CAC Benchmarks", 2026. https://saasadsstudio.com/research/b2b-saas-cac-benchmarks/
Reading this with a machine? Plain markdown version .
