
Research
Ad Price Inflation
Google's cost per click rose 4% and Meta's price per ad 14% in Q3 2026, while one B2B dataset has non-brand search clicks 29% dearer. Each figure dated.
Key figures
- Google Search & other average cost per click, Q3 2026, year on year (Alphabet's own metric, all advertisers)
- +4%
- Google Search & other paid clicks, Q3 2026, year on year
- +8%
- Meta average price per ad, Q3 2026, year on year (Meta's own metric, per ad shown, all advertisers)
- +14%
- Microsoft Search and advertising revenue ex TAC, FY27 Q1, year on year (new definition that includes LinkedIn ads)
- +12%
- Non-brand Google Search cost per click for Dreamdata's B2B customers, 2025 against 2024, in euros (vendor's own customer base)
- +29.36%
Whether ads are getting more expensive depends on whose number you read. The sellers publish their own averages every quarter, and a few buyer-side datasets measure groups of advertisers once a year, and they disagree. This page sets the four biggest sellers’ third quarter 2026 metrics beside the buyer-side measurements, says what each one counts, and shows the working wherever a figure is derived here. Every money figure is in the currency its source used, and nothing has been converted.
What the sellers report
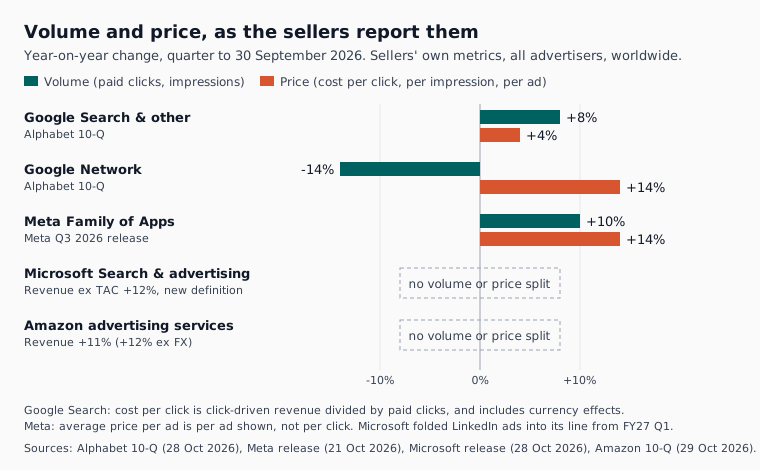
Two of the four largest ad sellers publish a price metric: Alphabet and Meta. Microsoft and Amazon publish revenue growth only, so for them there is no way to separate paying more per ad from buying more ads. The figure above draws all four for the quarter to 30 September 2026, each from the company’s own filing or release, linked in the sections below.
Google: clicks up 8%, cost per click up 4% {#google}
In the quarter to 30 September 2026, paid clicks on Google Search and its other properties rose 8% year on year and the average cost per click rose 4%, according to Alphabet’s Form 10-Q, dated 28 October 2026 and read on 4 November 2026. On Google Network partner sites, impressions fell 14% and cost per impression rose 14%. PPC Land’s write-up of the filing, published 29 October 2026, carries the same four figures.
Earlier in the year the pattern was different. Paid clicks rose 13% and cost per click 5% in the quarter to 31 March 2026, as shown in Alphabet’s first quarter 10-Q. In the quarter to 30 June 2026, clicks rose 13% and cost per click 3%, according to the second quarter 10-Q. Both were read on 4 November 2026. So across 2026 Google’s average click price has risen at 3% to 5% a year, while the growth in click volume has slowed.
Alphabet defines cost per click as click-driven revenue divided by paid clicks, and the 10-Q lists device mix, geographic mix, product mix and foreign currency exchange rates among the things that move it. It is an average across every auction, market and property in the segment, including Gmail, Maps and Play, as PPC Land quotes from the filing. A 4% rise in the average does not mean any one advertiser paid 4% more.
Meta: price per ad up 14% {#meta}
Meta reported ad impressions across its Family of Apps up 10% year on year and average price per ad up 14% for the quarter to 30 September 2026, in its third quarter 2026 results, released 21 October 2026 and read on 4 November 2026. Total revenue was $64.60 billion in US dollars, up 26% on both a reported and a constant currency basis. Family daily active people averaged 3.64 billion in September 2026, which is a count across Facebook, Instagram, Messenger and WhatsApp, not Facebook alone.
Advertising revenue alone was $63,061 million in US dollars, against $50,082 million a year earlier, in Note 2 of Meta’s Form 10-Q, read on 4 November 2026.
These are Meta’s figures about itself. Price per ad is revenue per ad shown across every advertiser, objective and country. It is not a cost per click, and it says nothing about what a lead or a trial costs.
Microsoft: a new line that now includes LinkedIn {#microsoft}
Microsoft reported Search and advertising revenue excluding traffic acquisition costs up 12% year on year for the quarter to 30 September 2026, its fiscal 2027 first quarter, with no currency effect, in its first quarter results, released 28 October 2026 and read on 4 November 2026.
That 12% is not Bing. From fiscal 2027, the metric includes LinkedIn Marketing Solutions and LinkedIn Premium Subscriptions alongside search advertising, as set out in Microsoft’s FY27 segments and investor metrics exhibit, filed in September 2026 and read on 4 November 2026. The same exhibit restates the old quarters. For the quarter to 30 June 2026, search advertising ex TAC growth was reported as 10% under the old definition and reads 13% on the new one. The new definition therefore added 3 percentage points to that quarter (13 minus 10, derived on this page). There is no standalone LinkedIn revenue growth series after the quarter to 30 June 2026, and Microsoft publishes no price or volume split for either business.
Amazon: revenue only {#amazon}
Amazon reported advertising services revenue of $19,637 million in US dollars for the quarter to 30 September 2026, against $17,703 million a year earlier, up 11% reported and 12% excluding exchange rate changes, as Relevant Audience reads from Amazon’s supplemental table, read on 4 November 2026. Amazon’s 10-Q confirms the 12% and says it was affected by timing anomalies, primarily related to Prime Day. Amazon publishes no ad price or volume metric, so its growth cannot be split into the two.
What buyers measured {#buyers}
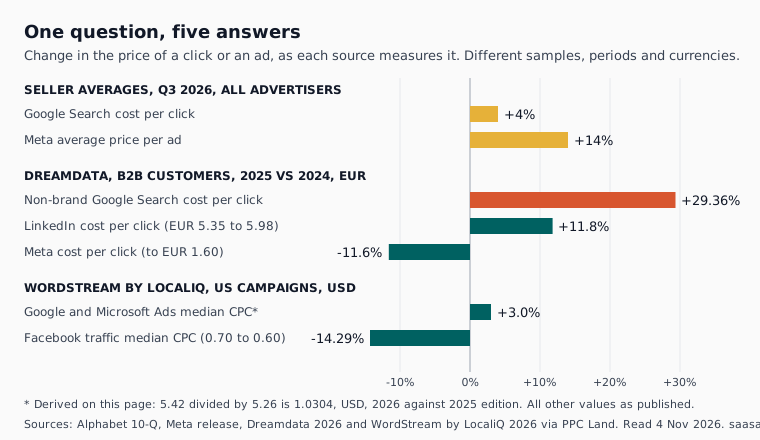
Dreamdata’s LinkedIn Ads Benchmarks Report 2026, published 10 March 2026 and covering calendar 2025 for the B2B companies that use its attribution software, reports non-brand Google Search cost per click up 29.36% and click-through rate down 26.16% against 2024. LinkedIn cost per click rose from €5.35 to €5.98, which the report calls an 11.8% increase, and Meta cost per click fell 11.6% to €1.60. All are in euros and all are from PPC Land’s write-up of the report, read on 4 November 2026. Dreamdata is a vendor measuring its own customers, so this is its claim about its client base, not a market survey.
WordStream by LocaliQ’s 2026 Google Ads benchmarks, published 19 May 2026, give a median cost per click of $5.42 in US dollars across 13,474 US search campaigns run on Google Ads and Microsoft Ads between 1 April 2025 and 31 March 2026, against $5.26 in the 2025 edition. Both figures are carried by PPC Land’s write-up, read on 4 November 2026. The change is +3.0%: derived on this page, 5.42 divided by 5.26 is 1.0304, both in US dollars.
The same publisher’s Facebook Ads Benchmarks 2026, published 14 September 2026, puts the median cost per click for US traffic campaigns at $0.60 in US dollars, down 14.29% from $0.70, as PPC Land reported, read on 4 November 2026. WordStream and LocaliQ are one company and one dataset, its campaigns are its own customers’, and WordStream is on this site’s competitor list, so we name it and do not link it: the pages are at wordstream.com/blog/2026-google-ads-benchmarks and wordstream.com/blog/facebook-ads-benchmarks-2026.
Why the numbers disagree {#arithmetic}
Seller revenue growth is roughly volume growth multiplied by price growth, and the two sellers that publish both reconcile. For Google, 1.08 multiplied by 1.04 is 1.1232, so 8% more clicks at a 4% higher average price implies growth of about 12.3%. Alphabet’s 10-Q reports Google Search & other revenue of $63,350 million against $56,567 million, in US dollars, which is 1.1199, or 12.0% (both derived on this page from Alphabet’s 10-Q, read on 4 November 2026). For Meta, 1.10 multiplied by 1.14 is 1.254, about 25.4%, against advertising revenue growth of 63,061 divided by 50,082, which is 1.2592, or 25.9% (derived on this page from Meta’s 10-Q and release, read on 4 November 2026). The small gaps are mix and rounding in the published percentages.
The buyer-side figures cannot be squared with the sellers’ in the same way, for three reasons. They cover different periods: calendar 2025 for Dreamdata, April 2025 to March 2026 for the WordStream by LocaliQ search set, and the quarter to September 2026 for the filings. They cover different advertisers: B2B software customers of one attribution vendor, US campaigns from one ad platform’s client base, and every advertiser worldwide. And they price different units: a click, against an ad shown. A B2B advertiser bidding on non-brand terms and a US local business can both be buying Google clicks in the same year and see a 29% rise and a 3% rise, as the Dreamdata and WordStream by LocaliQ write-ups show.
So there is no single ad inflation rate. The honest summary is that Google’s average click price is rising slowly, Meta’s average ad price is rising faster than its impressions, and competitive B2B search terms have been rising fastest of all in the one B2B dataset that measures them.
What this means if you are running ads
For a B2B SaaS, the seller averages are background. What matters is whether your own non-brand cost per conversion is climbing, and why: a rising price, a falling conversion rate, or spend leaking onto search terms that never convert. The page on what a SaaS keyword costs by length and the budget bands page are the places to start, and the full set of research pages is at saasadsstudio.com/research.
Atlas runs a SaaS Google Ads account week after week and applies changes at the approval tier you set, and you can undo any change, as the Google Ads for SaaS page describes. You can connect an account at app.saasadsstudio.com.
Method
Every figure on this page was read on 4 November 2026 from the page linked beside it. Alphabet’s quarterly metrics were read from the three 2026 Form 10-Q filings as quoted from sec.gov in search results, because the filings would not open directly that day, and the third quarter figures were checked against PPC Land’s write-up of the same filing. Meta’s figures were read off its own release and its 10-Q. Microsoft’s growth rate was read off its release, and the definition change and restated series off its September 2026 exhibit. Amazon’s revenue was read from Relevant Audience’s reading of Amazon’s supplemental table and the growth rate checked against Amazon’s 10-Q.
Derived figures on this page, each shown with its working where it appears: the 3 percentage points the new Microsoft definition added to the quarter to June 2026 (13 minus 10); the WordStream by LocaliQ Google cost per click change of +3.0% (5.42 divided by 5.26); Google’s implied revenue growth of 12.3% (1.08 multiplied by 1.04) against 12.0% reported in dollars (63,350 divided by 56,567), from Alphabet’s 10-Q; and Meta’s implied 25.4% (1.10 multiplied by 1.14) against 25.9% (63,061 divided by 50,082), from Meta’s 10-Q. The Microsoft inputs are in its September 2026 exhibit and the WordStream by LocaliQ inputs in PPC Land’s write-up.
Which figures are a company’s claim about itself: every seller metric on this page is the seller’s own measure of its own business, from its investor filings. Dreamdata’s and WordStream by LocaliQ’s figures are each a vendor describing its own customers. No SaaS Ads Studio or Atlas account data is used on this page. No currency has been converted: the seller figures and WordStream by LocaliQ figures are in US dollars, and Dreamdata’s are in euros.
Questions people ask about this
- How much more expensive did Google Ads get in 2026?
- Alphabet's own average cost per click for Google Search and its other properties rose 5%, 3% and 4% year on year in the first three quarters of 2026. That is an average across every advertiser, country and device, and it includes currency effects, so a single account can move very differently.
- Is Meta's 14% rise in price per ad the same as a 14% rise in cost per click?
- No. Meta's average price per ad is revenue per ad shown, across every advertiser and objective worldwide. In its 2026 edition, the most-cited US benchmark recorded Facebook traffic clicks getting cheaper, falling 14.29% to $0.60 in US dollars. Both can be true because they measure different things.
- Can I still compare LinkedIn ad revenue growth year on year?
- Not as a standalone line. From its FY27 first quarter, Microsoft reports LinkedIn Marketing Solutions and Premium Subscriptions inside Search and advertising revenue ex TAC, alongside Bing. Use Microsoft's recast series for any comparison, and do not call the new figure Bing growth.
- Which figure should a B2B SaaS use to plan next year's search budget?
- None of these is a SaaS figure. The nearest is Dreamdata's non-brand Google Search cost per click for its B2B customers, up 29.36% in euros for 2025 against 2024, but it is a vendor measuring its own client base. Your own account's trend in cost per conversion is a better planning input than any of them.
Sources
- 1. Alphabet Inc., Form 10-Q for the quarter to 30 September 2026 (dated 28 October 2026), monetisation metrics Read 2026-11-04.
- 2. Alphabet Inc., Form 10-Q for the quarter to 30 June 2026 Read 2026-11-04.
- 3. Alphabet Inc., Form 10-Q for the quarter to 31 March 2026 Read 2026-11-04.
- 4. PPC Land, write-up of Alphabet's Q3 2026 Form 10-Q (29 October 2026) Read 2026-11-04.
- 5. Meta Platforms, Third Quarter 2026 Results (21 October 2026) Read 2026-11-04.
- 6. Meta Platforms, Form 10-Q for the quarter to 30 September 2026, Note 2 revenue Read 2026-11-04.
- 7. Microsoft, first quarter fiscal year 2027 results (28 October 2026) Read 2026-11-04.
- 8. Microsoft, FY27 Segments and Investor Metrics, Form 8-K Exhibit 99.1 (September 2026) Read 2026-11-04.
- 9. Amazon.com, Form 10-Q for the quarter to 30 September 2026, guidance section Read 2026-11-04.
- 10. Relevant Audience, Amazon Q3 2026 ad revenue, reading Amazon's supplemental table Read 2026-11-04.
- 11. PPC Land, write-up of Dreamdata's LinkedIn Ads Benchmarks Report 2026 (10 March 2026) Read 2026-11-04.
- 12. PPC Land, write-up of the WordStream by LocaliQ 2026 Google Ads benchmarks (29 June 2026) Read 2026-11-04.
- 13. PPC Land, write-up of the WordStream by LocaliQ Facebook Ads Benchmarks 2026 (14 September 2026) Read 2026-11-04.
Cite this page
Free to quote and free to cite, with a link back. No permission needed.
The SaaS Ads Studio, "Ad Price Inflation", 2026. https://saasadsstudio.com/research/ad-price-inflation/
Reading this with a machine? Plain markdown version .
